


European stock markets faced a real-world stress test in October 2026. On the weekend of October 17, violence spread across France. Rioters looted shops in Paris and Lyon and set fire to the town hall in Limoges. Police made about 2,400 arrests, and nearly 1,000 officers, gendarmes and firefighters suffered injuries. The French think tank IFRAP estimates the damage at up to €1.1 billion.
European stock markets barely flinched. The CAC 40 fell about 1.1% on Monday, October 19. By November 5, it closed at 8,205, above its pre-riot close of 7,957. The bond market, however, told a very different story.
This tension sits at the heart of a popular thesis. It holds that street riots will collapse European exchanges and push savers to move money out of Europe. This analysis tests it against market history and current data. It also identifies the conditions under which the thesis could come true.
The Cultural Argument Behind the Market Thesis
The thesis rests on a cultural argument. Its supporters say mass migration and low birth rates are reshaping Europe. They also contend that Europe has lost confidence in its own culture and traditions. In their view, Western institutions increasingly question their own history and legitimacy. As a result, they argue, authorities hesitate to defend civil order firmly.
The market thesis builds on this framework. Weak social cohesion leads to riots; riots expose a weak state, and investors then flee. Critics, by contrast, argue that this view overstates cultural causes and underplays economic ones. That debate matters for investors, because the causes of recent unrest differ sharply.
| Episode | Trigger | Scale |
|---|---|---|
| France, June to July 2023 | Police shooting of a teenager in Nanterre | 11 nights; about 3,800 arrests; about €1bn in damage |
| United Kingdom, July to August 2024 | Anti-immigrant violence after misinformation about the Southport attack | More than 1,000 arrests within two weeks |
| France, October 2026 | Cost-of-living and school-funding protests that turned violent | About 2,400 arrests; up to €1.1bn in damage |
In other words, the unrest has had different roots in each case. The 2023 French riots began as anger at police. The 2024 British riots targeted migrants and mosques. October 2026 started as a protest over living costs and schools. The cultural argument fits some episodes better than others. Still, every episode raised the same question for investors: who pays, and can the state afford it? For markets, the cause of a riot matters less than the state’s capacity to pay for its consequences.
What European Stock Markets Did During Past Riots
History offers a consistent pattern. Equity markets have treated riots as local, temporary shocks.
| Episode | Equity reaction | What actually drove markets |
|---|---|---|
| Yellow vests, late 2018 | CAC moved almost in line with the DAX and S&P 500 | Global growth fears and US rates |
| Nanterre riots, 2023 | CAC 40 rose 3.3% that week | Earnings and global risk appetite |
| UK riots, 2024 | FTSE fell during the global sell-off of August 5, then recovered | Yen carry-trade unwind and US recession fears |
| France, October 2026 | CAC 40 fell about 1.1%, then rose above its pre-riot level | Earnings, rates and a US tech sell-off |
The reasons are structural. Large European companies earn much of their revenue abroad. About 45% of CAC 40 shares belong to foreign investors, according to MoneyWeek. A luxury group selling handbags in Shanghai does not depend on calm streets in Lyon. Insurers also absorb most of the physical damage. IFRAP estimates insurers will carry about €800 million of the October bill.
The pain still lands somewhere, though. On October 19, retailers, landlords and hotels led the declines. Carrefour, Unibail-Rodamco-Westfield and Accor each fell nearly 3%. Riots hit domestic consumer stocks, not the export giants that dominate the index.
The UK case shows the same logic. Investors who track the FTSE 100 saw global forces swamp local unrest in August 2024. Similarly, German markets follow exports and energy more than domestic politics, as the DAX disconnect shows.
Where the Thesis Holds: Bonds, Not European Stock Markets
The bond market is a different matter. France entered October 2026 with a deficit near 5.4% of GDP and debt near 120% of GDP. The 10-year OAT yield had already touched 4.99% on October 1, its highest since 2002.
The riots added pressure to an already strained system. On October 22, the 10-year yield climbed to 5.11%, according to Reuters. The spread over German Bunds reached 173.6 basis points, the widest since November 2011. Briefly, France even paid more than the US Treasury to borrow for ten years.
| French fiscal indicator | Figure |
|---|---|
| Deficit, 2026 | About 5.4% of GDP |
| Public debt | About 119% to 120% of GDP |
| Debt interest, 2026 | More than €79 billion |
| Debt interest, 2027 (projected) | More than €91 billion |
| Peak OAT-Bund spread (October 22) | 173.6 basis points |
| Share of French debt held by non-residents | 57.5% |
| Moody’s rating (October 23 review) | Aa3, negative outlook |
Higher sovereign yields also raise borrowing costs for French banks, companies and homeowners. In turn, that pressure can slow growth and widen the deficit further. Notably, bond investors did not price the damage itself. IFRAP attributes the spread mainly to the political and budget context, not the repair bill. Investors asked a sharper question: can a state facing riots still pass a credible budget?
Why Non-Resident Ownership Matters
Foreign investors hold 57.5% of French government debt. That creates the most realistic channel for capital flight. If those holders demand much higher yields or sell, borrowing costs rise for the entire French economy. Banks holding French bonds then take losses, and credit tightens. Economists call this the sovereign-bank “doom loop,” and it drove the 2011 to 2012 euro crisis.
Greece showed where that loop can end. Its banks lost a large share of their deposits between 2010 and 2015. Athens then imposed capital controls in June 2015. Riots accompanied that crisis, but insolvency drove the capital flight. Capital flees broken balance sheets, not broken windows.
The Missing Evidence: Capital Still Flows Into European Stock Markets
The thesis predicts that savers will move money out of Europe. So far, the data point the other way. In February 2026, European equity funds attracted two consecutive weeks of roughly $10 billion each, according to EPFR data. Investors cited cheaper valuations than in the US and concerns about AI concentration.
European ETFs gathered €221.7 billion in the first half of 2026, a record pace, according to LSEG Lipper. Within that total, however, Europe-focused equity ETFs recorded three straight months of outflows by mid-year. That shift deserves attention, although it predates the October unrest.
The currency shows strain but not flight. ING cut its year-end EUR/USD target to 1.13 after the riots. That move reflects modest pressure, not a run on the euro. Meanwhile, investors seeking protection have other options, from Bunds to gold.
An Early-Warning Dashboard for Investors
Because the bond market moves first, investors can track a short list of signals. Each one would flash before a broad equity collapse.
| Signal | Current reading | Warning level (our judgment) |
|---|---|---|
| OAT-Bund 10-year spread | About 148 to 174 bp in recent weeks | Sustained above 175 bp |
| French 10-year OAT yield | 4.74% at the November 5 auction | Sustained above 5.25% |
| Non-resident share of French debt | 57.5% | A visible decline at auctions |
| EUR/USD | Near 1.12 | A break below 1.10 |
| TTF gas, month-ahead | Above €100/MWh in late October | Sustained spikes in a cold snap |
| Rating outlook | Moody’s Aa3, negative | A downgrade below the AA range |
These thresholds are our own judgment, not official triggers. Taken together, however, they would show stress moving from bonds into the broader economy. No single protest weekend moves all six signals at once.
The Accelerants: Energy, the ECB and the Budget Calendar
Riots become dangerous for markets when they meet other stresses. Three accelerants now stand out.
An Energy Shock Entering Winter
First, Europe faces a fragile winter. EU gas storage stood at 74.6% on November 1, against 82.9% a year earlier. The month-ahead TTF benchmark hit €104.90/MWh on October 28, its highest since December 2022. The disruption of LNG flows through the Strait of Hormuz cut Qatari and Emirati loadings sharply.
The IEA warns storage could fall below 10% by end-March 2027 in a cold winter. High energy bills fuel cost-of-living anger, the very trigger behind October’s protests. Readers can follow that link in our natural gas outlook.
An ECB With Limited Room
Second, the European Central Bank has a tool for bond stress: the Transmission Protection Instrument, created in July 2022. Its use, however, requires compliance with the EU fiscal framework. France remains under an excessive deficit procedure. Continuum Economics argues that France does not meet the criteria. Markets also price ECB rate hikes, from a 2.50% deposit rate today toward 3.26% by late 2027.
A Crowded Political Calendar
Third, the 2027 budget remains unresolved, and the 2027 presidential election approaches. Deutsche Bank noted that the riots add a layer of political risk before that vote. Consequently, each new protest day now tests the budget, not just public order.
Scenarios: When the Thesis Could Come True
The stress test points to a clear conclusion. Riots alone have not collapsed European stock markets. Riots combined with a fiscal crisis and an energy shock could.
| Scenario | Conditions | Likely market outcome |
|---|---|---|
| Contained unrest | Protests fade; budget passes; mild winter | Spread narrows; CAC follows earnings |
| Bond stress | Protests continue; budget delayed; ratings pressure | Spread holds above 150 bp; banks and domestic stocks lag |
| Systemic stress | Sustained riots, budget failure, gas shortage, no ECB backstop | Non-residents sell OATs; banks fall; broad equity sell-off; euro weakens |
These scenarios reflect our judgment, not forecasts. In our view, the third scenario would need several failures at once. Even then, the first casualty would likely be French debt, not European equities as a whole. The real risk is a slow erosion of fiscal credibility, not a single night of violence.
Investors who follow geopolitical risk and volatility will recognize the pattern. Shocks compound when they hit the same weak point.
The Risks That Matter for European Stock Markets
- Sovereign spreads. A sustained OAT-Bund spread above 170 bp would signal rising stress.
- Budget failure. A collapsed 2027 budget could trigger rating downgrades.
- Energy. Low gas storage leaves Europe exposed to a cold winter.
- ECB limits. France may not qualify for TPI support.
- Banks. French bank shares carry direct exposure to sovereign bonds.
- Social unrest. Repeated protests could erode fiscal discipline and investor trust.
- Elections. The 2027 French presidential vote adds political uncertainty.
Closing Thoughts
Riots in 2018, 2023, 2024 and 2026 did not collapse European stock markets. Indeed, capital kept flowing into European equities through much of 2026.
The bond market, however, has started to price a different risk. French borrowing costs now sit at crisis-era spreads, with foreign investors holding most of the debt. In our view, street unrest matters because it tests a heavily indebted state’s ability to govern. If capital leaves Europe, it will likely exit through the French bond market first.
Sources
- IFRAP: Cost of the October 17–18, 2026 violence
- Admiral Markets: France riots and the stock market, CAC 40, banks, OATs
- ABC Bourse: Markets fall after riots in France (October 19, 2026)
- Tradingsat: France’s image further dented in the eyes of markets
- Reuters via Yahoo Finance: French debt risk premium reaches crisis levels
- Disruption Banking: French yields cross 5%, spread widest since 2011
- Eurasia Business News: Moody’s keeps France’s Aa3 rating
- Foreign Policy Journal: France’s interest bill heads toward €132 billion
- Trading Economics: CAC 40 close, November 5, 2026
- MoneyWeek: The market reaction to the French riots
- European Business Magazine: Record sums flow into European stocks
- LSEG Lipper: European ETF flows, H1 2026
- S&P Global: IEA warns low EU gas stocks reduce buffer
- oEnergetice: EU gas storage less than three-quarters full
- Deutsche Bundesbank: Transmission Protection Instrument
- Continuum Economics: ECB won’t come to France’s rescue
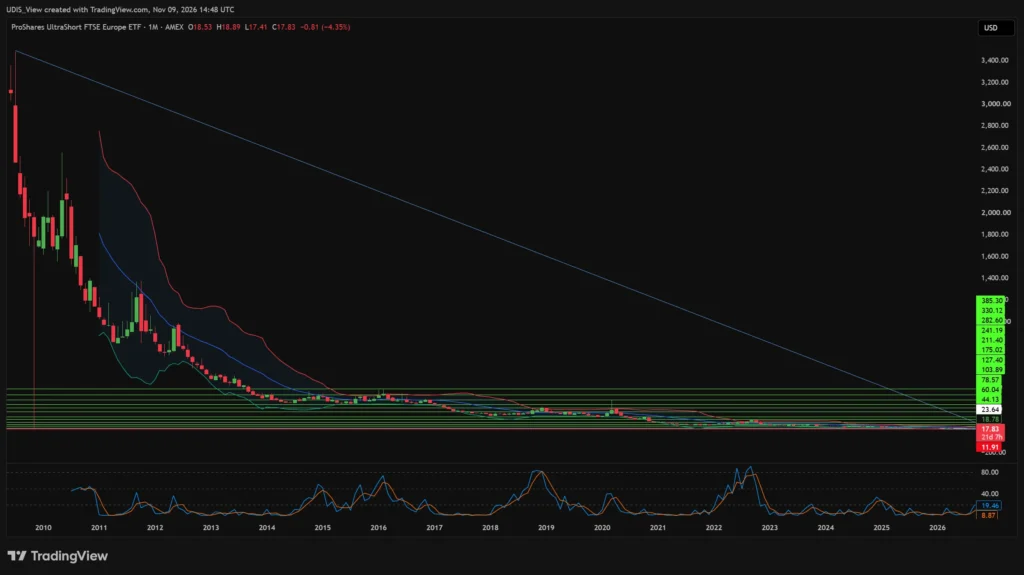
EPV Long (Buy)
Enter At: 23.64
T.P_1: 44.13
T.P_2: 60.04
T.P_3: 78.57
T.P_4: 103.89
T.P_5: 127.40
T.P_6: 175.02
T.P_7: 211.40
T.P_8: 241.19
T.P_9: 282.60
T.P_10: 330.12
T.P_11: 385.30
S.L: 11.91