
Introduction and Market Evolution
Eli Lilly GLP-1 strategies transform the firm from a traditional drug maker into a high-tech powerhouse. Lilly leverages massive capital and artificial intelligence to dominate metabolic health. The recent $1 trillion market capitalization reflects a systemic evolution in the pharmaceutical sector.
Lilly integrates cutting-edge science with autonomous manufacturing systems to drive growth. The company leads the obesity therapeutics market with the dual agonist compound tirzepatide. Direct-to-consumer platforms like LillyDirect provide a sophisticated multi-domain strategy for market expansion.
Lilly delivered 2025 revenue of $65.2 billion, fueling a 40% total shareholder return. For 2026, the company issued revenue guidance between $80 billion and $83 billion. Projected 2026 growth relies on unprecedented volume expansion in the company’s GLP-1 portfolio.
Geopolitical Risk and Supply Chain Reshoring
Geopolitical tensions between the U.S. and China pose significant structural risks to pharmaceutical firms. The BIOSECURE Act aims to restrict U.S. businesses from working with Chinese biotechnology firms. This legislation targets firms deemed national security risks, primarily focusing on major entities like WuXi AppTech.
Lilly reevaluates deep ties to the Chinese biotech sector to ensure long-term stability. Consequently, supply chain reshoring has become a strategic necessity for global pharmaceutical giants. Lilly invests heavily in domestic production to mitigate the risk of supply chain decoupling.
The 2032 compliance deadline provides a window for transitioning away from Chinese manufacturers. However, the transition process remains costly and operationally complex for the biopharma industry. Geopolitical risks now represent a permanent and significant factor in biopharma investment strategy.
Table 1: Legislative and Geopolitical Risk Timeline
| Legislative Action | Primary Target | Compliance Deadline | Strategic Impact |
| BIOSECURE Act | Chinese Biotech (1260H) | 2032 (Transition) | Supply Chain Reshoring |
| 1260H List Updates | Military-Connected Firms | Ongoing | Vendor Disruption |
| Export Restrictions | Rare Earths / APIs | Immediate Potential | Increased COGS |
The Manufacturing Moat and Infrastructure Strategy
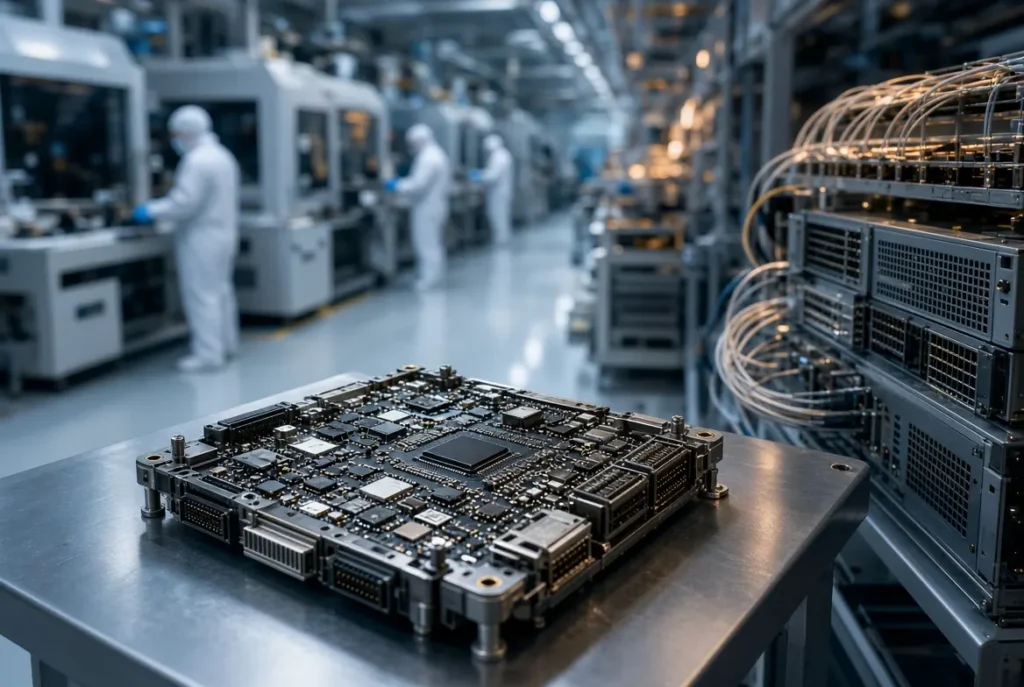
Lilly builds a massive manufacturing moat to sustain its dominance in the Eli Lilly GLP-1 market. The company invested over $55 billion into thirteen new manufacturing sites. Substantial capital expenditure locks out smaller competitors who lack similar financial resources.
In the Netherlands, Lilly builds a $3 billion facility featuring advanced “dock-to-dock” automation. This facility focuses on oral medicines like orforglipron to increase production efficiency. Automation ensures sterility and allows materials to move without human handling.
Moreover, the company expands its European footprint with new facilities in Ireland and Germany. Localization allows Lilly to respond quickly to regional demand spikes for biologic ingredients. A €400 million facility in Limerick strengthens global supply chains for biologic active ingredients.
Table 2: Global Manufacturing Infrastructure (2026-2028)
| Site Location | Investment Value | Technology Focus | Operational Role |
| Katwijk, Netherlands | $3.0 Billion | Oral GLP-1 / Solid Dose | European Distribution |
| Limerick, Ireland | €400 Million | Biologic Ingredients | Global Supply Support |
| Concord, NC | Multi-Billion | Parenteral / Devices | North American Volume |
| Lebanon, Indiana | Multi-Billion | Next-Gen Multi-Modality | Domestic Resilience |
Pipeline Innovation and Clinical Dominance
Tirzepatide serves as the primary engine for Lilly’s current clinical and financial success. This dual agonist improves glycemic control and reduces food intake. In head-to-head trials, tirzepatide delivered 23.6% weight loss, outperforming rival semaglutide.
Beyond weight loss, tirzepatide improves cardiovascular risk factors and reduces systemic inflammation. These multi-outcome benefits are critical for securing long-term payer reimbursement. Therapeutic dominance justifies the drug’s price as a preventative medical intervention.
Meanwhile, Lilly advances retatrutide, a first-in-class triple agonist for metabolic health. Clinical data shows patients lost 16.8% of their weight in only 40 weeks. Retatrutide sets a new benchmark for potency and continues weight loss throughout trial periods.
Table 3: Pipeline Candidate Comparative Potency
| Molecule | Type | Primary Target | Key Phase 3 Finding |
| Tirzepatide | Injectable | GIP / GLP-1 | 23.6% Weight Loss |
| Retatrutide | Injectable | GIP/GLP-1/Glucagon | 16.8% Weight Loss (40 wks) |
| Orforglipron | Oral | GLP-1 | Superior Glycemic Control |
AI Drug Discovery and Technology Integration
Lilly merges biology with supercomputing to accelerate the discovery of new medicines. The company partnered with NVIDIA in a $1 billion deal to build “AI factories“. Lilly currently moves 3.5 years faster than the industry average in molecule discovery.
The company also signed a $2.75 billion deal with Insilico Medicine for AI drug discovery. Insilico’s platform designs novel drug compounds in just 18 months. Generative AI reduces R&D costs and shortens the path from discovery to clinical launch.
Lilly integrates AI into clinical trial design to predict disease progression and improve success. This data-driven approach reduces regulatory delays through better patient stratification. Ultimately, AI and technology integration safeguard the company’s competitive advantage in a crowded market.
Financial Performance and Valuation
Lilly targets a 2026 performance margin between 46.0% and 47.5%. High operating margins reflect the scale benefits of successful Eli Lilly GLP-1 therapeutics. Scale economies allow Lilly to absorb pricing pressure better than smaller industry rivals.
The company trades at a price-to-earnings ratio between 38x and 43x. This premium reflects high investor confidence in future growth and pipeline innovation. However, interest rate fluctuations could compress valuation multiples for high-growth stocks.
Lilly addresses payer reimbursement hurdles through the Lilly Employer Connect platform. These efforts bypass traditional pharmacy benefit manager (PBM) hurdles to expand patient access. Consequently, Medicare out-of-pocket costs for GLP-1s will be capped at $50 monthly starting in 2027.
Table 4: Financial Performance Ratios (2025-2026)
| Metric | 2025 Reported | 2026 Guidance / Goal | Year-over-Year Delta |
| Annual Revenue | $65.2 Billion | $80.0 – $83.0 Billion | +23% to +27% |
| Non-GAAP EPS | $24.21 | $33.50 – $35.00 | +38% to +45% |
| Gross Margin | 82.5% | ~83.5% (Projected) | +1.0% |
Strategic Risks and Investment Outlook
Lilly’s growth is protected by a formidable patent protection strategy. Tirzepatide is shielded by twenty-three separate U.S. patents. The estimated generic launch date for Zepbound is July 2039, ensuring long-term exclusivity.
However, the company faces immediate risks from aggressive manufacturing scaling. Any quality control failure at new sites could cause catastrophic supply delays. Intensifying price competition and stricter payer access controls also threaten realized prices.
Analyst sentiment for Lilly remains overwhelmingly positive with 91% “Buy” ratings. Most investment banks set price targets well above current share prices. Eli Lilly GLP-1 dominance makes the firm a high-conviction opportunity within the healthcare sector.
Table 5: Intellectual Property Expiration Forecast
| Drug Brand | Generic Name | Primary U.S. Expiry | Estimated Generic Launch |
| Zepbound | Tirzepatide | 2031 (Molecular) | 2039 (Combined) |
| Mounjaro | Tirzepatide | 2031 (Molecular) | 2036 (Earliest) |
| Olumiant | Baricitinib | 2030 | 2033 (JP) |
Investment Opportunities to Monitor:
- Pipeline Catalysts: Watch for Phase 3 data presentations in June 2026.
- Manufacturing Milestones: Track the operational readiness of the Katwijk and Limerick facilities.
- Regulatory Shifts: Monitor Medicare reimbursement policy implementations in 2026 and 2027.
- Competitive Landscape: Observe efficacy data from oral GLP-1 competitors like Structure Therapeutics.
Eli Lilly Long (Buy)
Enter At: 894.67
T.P_1: 923.30
T.P_2: 976.69
T.P_3: 1033.56
T.P_4: 1075.72
T.P_5: 1117.88
T.P_6: 1171.39
S.L: 780.61