

The S&P 500 sits at a structural collision point. This S&P 500 market forecast weighs record AI-driven earnings momentum meets the most severe energy supply shock in modern history. On March 4, 2026, Iranian forces blockaded the Strait of Hormuz. That corridor carries 20% of global seaborne energy exports. Regional producers cut output by 10 million barrels per day. Brent crude surged past $120 per barrel. QatarEnergy declared force majeure on all LNG shipments. The real question is whether patent-protected scale can absorb a stagflationary shock the index has never faced at this valuation.
The Competitive Moat
Two proprietary advantages anchor the index’s heaviest constituents. The first is the completed inversion toward intangible assets. Intellectual property and software now represent 92% of total index capitalization, up from 17% in 1975. Earnings increasingly flow from scalable platforms, not commodity-exposed physical assets. This structural shift insulates core profits from transitory energy cost spikes.
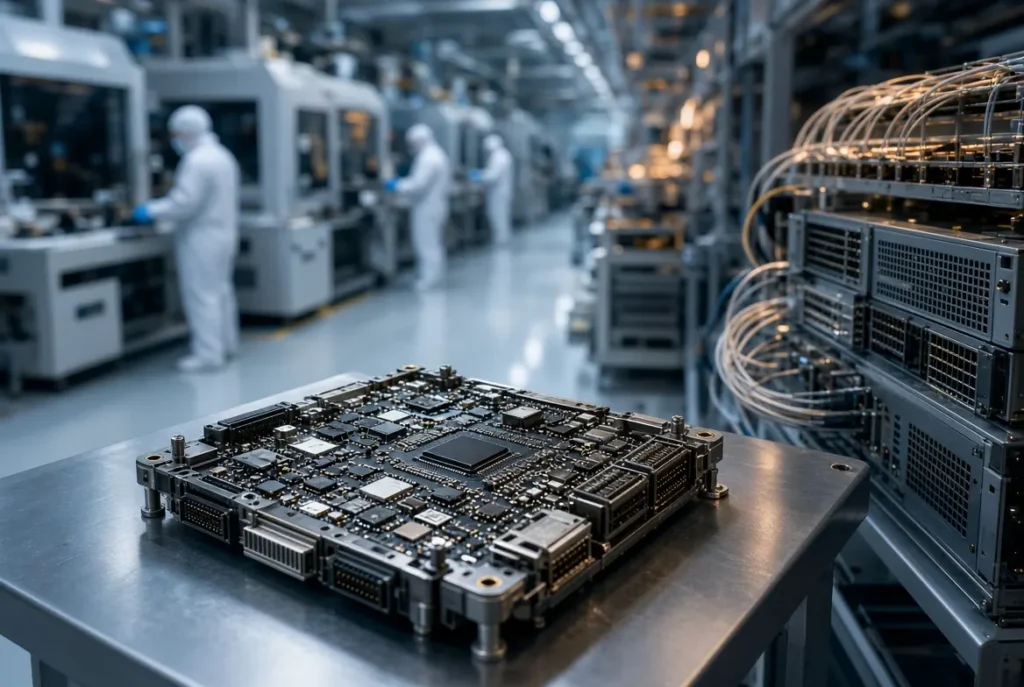
The second advantage is the scale of coordinated AI infrastructure spending. Morgan Stanley expects the five largest technology companies to deploy $800 billion in 2026. That figure scales to $1.16 trillion in 2027 across silicon, servers, cloud, and cooling. That buildout deepens AI’s power crisis, where fusion and next-generation energy plays now chase the same demand. This capital lifts the index-wide profit margin toward 13.9%, the highest since 2008. No pure cyclical index can replicate owned infrastructure at this scale.
The Strategic Alliance
The moat rests on a tight alliance between platform leaders, foundries, and materials innovators. $NVDA and Meta depend on $TSM wafer advances and Samsung packaging to convert research into deployable silicon. Diffusion from academic material science feeds the next layer. Coaxial carbon nanotube yarn and silicon anode solutions now enter enterprise pilots. These supply the power density that data centers demand amid sustained oil shocks. Small modular reactors are emerging as a baseload option for those loads. SLB deploys machine learning for reservoir management and drilling optimization. Productivity gains accrue inside S&P 500 constituents rather than to foreign competitors.
Execution risk centers on capacity delivery. Any slippage in chip or power supply directly caps the 24% earnings growth Goldman Sachs projects for 2026 (forward-looking).
Patent Dominance and a Shifting Litigation Map
Patent strategy now dictates more than 87% of technology enterprise valuation. Samsung Electronics secured 7,526 US patents in 2025, with TSMC at 4,233 and Qualcomm at 3,925. $NVDA lifted filings 31% to 735 to defend its GPU designs. The litigation environment is shifting fast. PTAB petitions fell 64.2% year-over-year in Q1 2026 as discretionary denials rose. Ex parte reexamination requests surged 157.1% over the same period. Companies are rerouting IP defense through cheaper administrative channels to protect margin-driving moats.
Financial Fundamentals
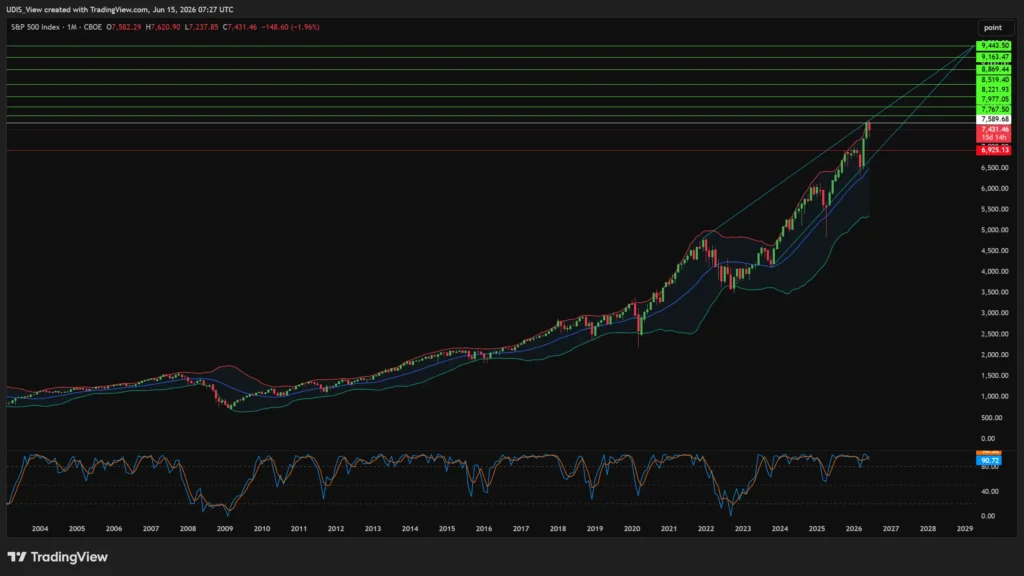
Genuine corporate earnings, rather than speculative hype, are keeping the index grounded near 7,430. This fundamental strength has prompted both Goldman Sachs and Morgan Stanley to lift their year-end targets to 8,000, fueled by forecasts of a 24% surge in 2026 EPS to $340. But there’s a major catch: the Shiller CAPE ratio has climbed to 41 a valuation height that has historically signaled painful market corrections.
| Metric | Value | Note |
|---|---|---|
| S&P 500 index level | 7,430 | Below June peak of 7,620 |
| Shiller CAPE ratio | 41 | Elevated vs long-term average |
| 2026 EPS forecast | $340 | +24% YoY (forward-looking) |
| Index profit margin | 13.9% | Highest since 2008 |
| Year-end targets | 8,000 | Goldman Sachs, Morgan Stanley (forward-looking) |
| $VOO 1-year return | +24% | Equity growth proxy |
| $GLD 1-year return | +24% | Down 24% from January peak |
| $DHS YTD return | +13% | Defensive value outperformance |
The market is pricing resilient earnings delivery, not geopolitical perfection.
The Macro and Energy Backdrop
The energy shock is feeding straight into prices. US CPI hit a three-year high of 4.2% in May 2026. Energy costs drove 60% of that acceleration. The 10-year Treasury yield climbed to 4.44% in late March. Higher funding costs raise the bill for the entire AI capex cycle. The Federal Reserve stays on hold, removing the rate relief equities usually lean on.
Risk Factors
Two data-backed risks threaten the thesis. First, a sustained Hormuz closure locks in the 10 million barrel daily loss and Brent above $120. That keeps CPI elevated, the Fed on hold, and credit growth constrained. Second, governance and cyber exposure is rising fast. Private shareholder class actions alleging AI fraud have doubled year-over-year. The SEC is intensifying enforcement against AI washing under the “knew or should have known” director standard. Deeper AI integration also widens the attack surface, where embedded security and connected-device risk move to the core. A 41 CAPE ratio leaves little cushion if these risks crystallize.
These risks justify a tactical hedge. $GLD returned 24% over the past year despite a 24% pullback from its January peak.
The Bottom Line
The S&P 500 market forecast offers a concentrated bet on AI infrastructure leadership prevailing over a verifiable energy shock. The decisive catalyst arrives with Q2 2026 earnings in July. Confirmation of 13.9% margins and early $800 billion AI monetization will either validate the 8,000 targets or expose the 41 CAPE under 4.2% inflation. Allocators should hold core $VOO exposure while adding defensive high-dividend vehicles. $DHS has already delivered 13% year-to-date outperformance. Treat the Hormuz shock as temporary noise around structural tech leadership, and the re-rating accrues as earnings confirmations arrive.
S&P 500 Long (Buy)
Enter At: 7589.68
T.P_1 : 7767.50
T.P_2: 7977.05
T.P_3: 8221.93
T.P_4: 8519.40
T.P_5: 8869.44
T.P_6: 9163.47
T.P_7: 9443.50
S.L: 6925.13