
The S&P 500’s Ascent: A Multifaceted Narrative
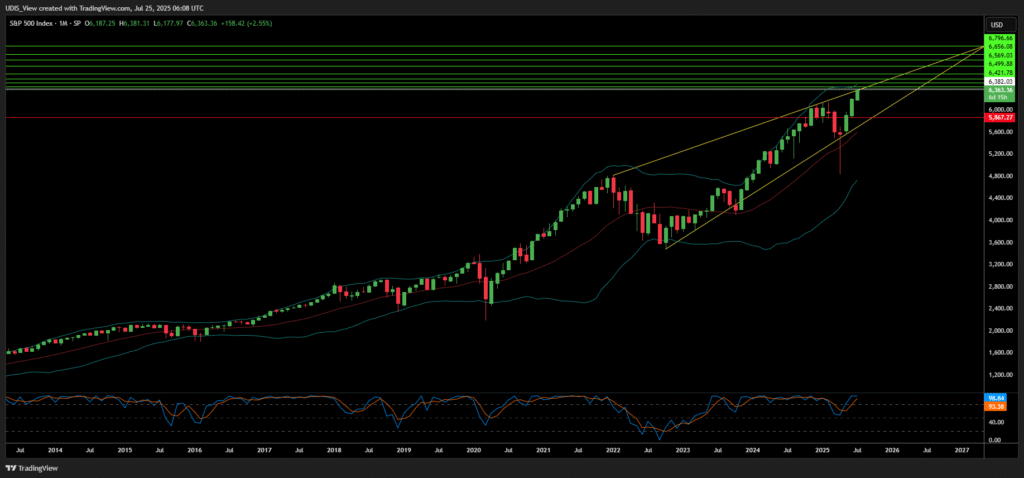
The S&P 500 index recently achieved new all-time highs, reflecting robust market confidence. This surge, up over 26% since April 8 lows, signals underlying strength.1 The index posted its tenth record in 19 sessions, driven by technology sector gains.2 This upward trajectory is not singular in cause. It stems from a complex interplay of geopolitical realignments, resilient macroeconomic indicators, and transformative technological advancements.
Understanding this trajectory requires examining macroeconomic strength, strategic geopolitical shifts, and technological advancements. The market has effectively absorbed initial uncertainties from earlier this year.1 Investors demonstrate growing confidence regarding the limited economic impact of recent tariff policies.2 This indicates a fundamental shift in investor perception. The market has processed initial concerns and now focuses on underlying financial strength and positive policy developments. This suggests a move from fear-driven trading to fundamentals-driven investment. This implies a more resilient market structure. It can absorb shocks more effectively when core economic data remains strong. The market views current policies as beneficial or manageable, contributing to this sustained performance.
Geopolitical Realignment and Strategic Trade
Global trade dynamics are undergoing a significant transformation, directly impacting the S&P 500. New bilateral agreements and evolving tariff policies are reshaping supply chains. These strategic moves bolster key American industries and foster economic growth.
Landmark Trade Deals: US-Japan and US-Indonesia Agreements
The United States secured significant trade agreements in July 2025. These deals reflect a strategic reorientation of global trade. They prioritize reciprocal market access and industrial revitalization.
A landmark economic agreement with Japan was announced on July 23, 2025.3. This historic deal involves a substantial $550 billion Japanese/USA investment vehicle.3 The United States will retain 90% of the profits from this investment.3 These funds specifically target America’s strategic industrial base. This includes energy infrastructure, semiconductor manufacturing and research, critical minerals mining, pharmaceutical production, and commercial and defense shipbuilding.3 The agreement also introduces a 15% reciprocal tariff on Japanese goods entering the U.S..4 Japan will open its markets to U.S. exports, including cars, trucks, rice, and agricultural products. Japan has also committed to purchasing 100 Boeing aircraft and billions of dollars in U.S. defense equipment.3 This deal aims to narrow the trade deficit with Japan 3. It reflects a commitment to a consistent, transparent, and enforceable trade environment 3
Just prior, on July 22, 2025, a historic trade deal with Indonesia was announced.5 This provides unprecedented market access for American goods.5 Indonesia will pay a reciprocal tariff rate of 19%.5 Indonesia will eliminate tariff barriers on over 99% of U.S. products across all sectors.5 This includes agriculture, health products, information and communications technology, automotive products, and chemicals.5 Non-tariff barriers will also be addressed. U.S. companies will be exempt from local content requirements.5 Indonesia will accept vehicles built to U.S. federal safety standards.5 The agreement strengthens rules of origin. It ensures benefits accrue primarily to the U.S. and Indonesia, not third countries 5 Indonesia committed to joining the Global Forum on Steel Excess Capacity.5 They will also remove restrictions on critical mineral exports to the U.S. 5 Commercial deals include $3.2 billion in aircraft, $4.5 billion in agriculture, and $15 billion in energy products.6
The strategic focus of the US-Japan investment vehicle on critical industries like semiconductors and critical minerals indicates a proactive geostrategic move beyond mere trade. The $550 billion investment targets “revitalization of America’s strategic industrial base”.3 This encompasses “Semiconductor manufacturing and research,” “Critical minerals mining,” and “Pharmaceutical and medical production”.3 These industries are vital for national security and economic resilience. Past dependence on foreign supply chains for these inputs has been a recognized vulnerability. This initiative is a deliberate geostrategic move. It aims to onshore critical manufacturing capabilities and secure supply chains. This reduces geopolitical vulnerabilities and enhances long-term national strength. Such investments could lead to sustained growth in these high-tech sectors within the S&P 500. It also signals a more protectionist but strategically focused trade policy. This could create a more stable and predictable environment for domestic companies in these sectors.
The “reciprocal tariff” approach signals a new, assertive U.S. trade policy. It aims to rebalance trade relationships rather than pursue traditional free trade. Both Japan and Indonesia will pay “reciprocal tariffs” to the U.S..4 The U.S. also imposes a 10% baseline tariff on nearly all imports.7 This approach reflects “the United States’ broader effort to establish a consistent, transparent, and enforceable trade environment”.3 It seeks to ensure American workers and producers are no longer disadvantaged by outdated or one-sided trade rules.3 This policy, while potentially creating short-term market volatility, aims for long-term rebalancing. If successful, it could lead to increased U.S. exports and domestic production. This would directly boost revenues for S&P 500 companies involved in these sectors. It also suggests a shift away from multilateral trade frameworks towards bilateral negotiations.
Evolving Tariff Landscape and Global Trade Dynamics
The U.S. trade policy has introduced significant shifts, including reciprocal tariffs. A 90-day pause on country-specific tariffs expired on July 9, 2025.7. This pushed trading partners towards new bilateral agreements. Deals have been finalized with the U.K. and China.7 The U.K. deal reduced tariffs on U.K. exports, while the U.S. gained agricultural market access.7 The China deal involves easing rare earth exports and lifting U.S. export controls.7
Negotiations continue with the EU, Canada, Thailand, Cambodia, Malaysia, the Philippines, and Taiwan.7 The EU is preparing contingency measures if no agreement is reached.7 The transatlantic trade relationship is the world’s most important.8 Goods and services trade reached €1.6 trillion in 2023.8. Despite this, no dedicated free trade agreement exists.8 The EU has paused countermeasures on U.S. tariffs to allow for negotiations.8
The market’s ability to “climb several walls of worry” 1 directly links to the uncertainty surrounding these reciprocal tariffs and negotiation deadlines. The S&P 500’s resilience, hitting new highs 2, despite these complex negotiations, indicates investor optimism. Investors either believe the outcomes of these deals will be favorable or that economic fundamentals are strong enough to absorb tariff costs.1 This suggests a perception that the tariff policy, while disruptive, is ultimately leading to beneficial outcomes for U.S. businesses. This implies that the market views these trade negotiations as a net positive or at least manageable. Continued success in securing bilateral deals could further reduce trade uncertainty. This would provide a clearer operating environment for S&P 500 companies, especially those with significant international exposure.
Strategic Industrial Base Revitalization
The new trade agreements are not merely about market access. They are foundational to a broader strategy of revitalizing America’s strategic industrial base. The US-Japan agreement specifically channels investment into energy infrastructure, semiconductor manufacturing, critical minerals, pharmaceutical production, and commercial/defense shipbuilding.3 Both the Japan and Indonesia deals emphasize strengthening vital supply chains.3 This includes addressing duty evasion and cooperating on export controls and investment security.5 The goal is to rebuild U.S. capacity from design to fabrication in semiconductors. It also aims to end U.S. dependence on foreign-made medicines and supplies.3
The explicit targeting of strategic industrial sectors for investment and revitalization, particularly semiconductors and critical minerals, positions the U.S. for long-term technological and economic leadership. This reduces reliance on potentially unstable foreign supply chains. This represents a deliberate policy shift towards industrial policy and economic nationalism. It aims to build self-sufficiency and reduce geopolitical leverage held by other nations over critical inputs. This is a long-term play for national security and economic stability. For S&P 500 companies in these sectors, this means sustained government and foreign investment. It suggests a more favorable domestic operating environment. This could lead to increased research and development, intellectual property creation, and ultimately, higher earnings and valuations for these firms. It also implies a potential shift in global manufacturing footprints.
Table 1: Key Bilateral Trade Agreement Highlights (July 2025)
| Agreement | Key Partner | Investment/Value | U.S. Profit Share | Targeted U.S. Industries/Exports | Strategic Implications |
| US-Japan | Japan | $550B Investment | 90% | Semiconductors, Energy, Pharma, Shipbuilding, Boeing Aircraft, Defense Equipment, Agriculture (Rice, Cars) | Industrial Base Revitalization, Supply Chain Security, Trade Deficit Reduction, Alliance Strengthening |
| US-Indonesia | Indonesia | 19% Reciprocal Tariff | N/A | Agriculture, Health, ICT, Automotive, Chemicals, Critical Minerals, Aircraft, Energy | Market Access, Non-Tariff Barrier Reduction, Supply Chain Resilience, Data Protection |
The table above aggregates crucial, high-impact geopolitical data into an easily digestible format. It allows readers to quickly grasp the scale and scope of these deals, which are direct catalysts for S&P 500 sectors. It visually reinforces the “geopolitical realignment” theme by showing concrete outcomes of the administration’s trade strategy.
Macroeconomic Strength and Corporate Performance
The S&P 500’s ascent is firmly rooted in robust corporate earnings and a resilient, albeit complex, macroeconomic environment. Various economic indicators paint a picture of underlying strength, supporting investor confidence.
Corporate Earnings and Market Valuations
The second quarter earnings season for the S&P 500 is off to a strong start.9 83% of reporting companies delivered actual EPS above estimates.9 This exceeds both the 5-year average of 78% and the 10-year average of 75%.9 In aggregate, companies report earnings 7.9% above estimates.9 The blended earnings growth rate for the second quarter stands at 5.6%.9 While this marks the lowest growth rate since Q4 2023 (4.0%), it also represents the eighth consecutive quarter of year-over-year earnings growth.9 Communication Services and Information Technology sectors lead year-over-year growth.9 The Energy sector, conversely, reports a decline.9
In terms of revenues, 83% of S&P 500 companies reported actual revenues above estimates.9 This surpasses the 5-year average of 70% and the 10-year average of 64%.9 The blended revenue growth rate for Q2 is 4.4%.9 This marks the 19th consecutive quarter of revenue growth for the index.9 The Information Technology sector leads revenue growth.9 The forward 12-month P/E ratio for the S&P 500 is 22.2.9. This remains above the 5-year average (19.9) and the 10-year average (18.4).9
The consistent beating of earnings estimates and the long streak of revenue growth directly explain the S&P 500’s upward trajectory. This strong corporate performance, particularly in high-growth sectors like Information Technology and Communication Services, overshadows some broader economic softness. The market clearly rewards companies that demonstrate robust profitability and revenue expansion. This suggests that the S&P 500’s performance is currently more sensitive to individual corporate health and sector-specific growth than to aggregate GDP figures. This highlights the index’s concentration in leading companies. While overall earnings are strong, the divergence where IT and Communication Services lead growth while Energy declines, and manufacturing grows modestly compared to services, indicates a nuanced economic picture. The robust services sector and tech-driven earnings suggest a two-speed economy. The high P/E ratio reflects investor optimism, potentially concentrated in these outperforming sectors. This divergence suggests that investors should carefully consider sector-specific exposures within the S&P 500. Not all segments are benefiting equally from current economic conditions.
Table 2: S&P 500 Q2 2025 Earnings Performance Snapshot
| Metric | Value | Comparison to Averages (5-yr / 10-yr) | Leading Sectors (Earnings/Revenue) | Lagging Sectors (Earnings) |
| Blended Earnings Growth Rate | 5.6% | Lowest since Q4 2023, 8th consecutive YOY growth | Communication Services, Information Technology | Energy |
| % Companies Beating EPS Estimates | 83% | Above 5-yr (78%) & 10-yr (75%) | Financials (the largest contributors to the surprise) | |
| Magnitude of EPS Surprises | 7.9% | Below 5-yr (9.1%), Above 10-yr (6.9%) | ||
| Blended Revenue Growth Rate | 4.4% | 19th consecutive quarter of growth | Information Technology | |
| Forward 12-month P/E Ratio | 22.2 | Above 5-yr (19.9) & 10-yr (18.4) |
This table provides a quick, quantitative summary of the S&P 500’s core performance driver: corporate profitability. It highlights areas of strength and weakness, allowing readers to see the earnings resilience despite broader economic nuances. This is essential for understanding market valuation and identifying which sectors are contributing most to the index’s gains.
Monetary Policy and Labor Market Dynamics
The Federal Reserve’s cautious stance on interest rates provides a critical liquidity and sentiment boost for the S&P 500. The next scheduled FOMC meeting is July 29–30, 2025.10. The Fed held rates at 4.25–4.50% in May and June.10 Chair Powell emphasized data dependency.10 Most projections signal two quarter-point cuts later in 2025.10. The Fed’s continued holding of rates, emphasizing data dependency, coupled with projections for future rate cuts, creates a supportive environment for equity markets. The market appears to be pricing in these anticipated cuts, contributing to the higher P/E ratio. However, robust employment data could delay these cuts, introducing volatility if expectations are not met. The S&P 500’s current valuation is highly sensitive to the Fed’s future actions. It also depends on market perceptions of the interest rate trajectory. Any shift in the Fed’s dovish outlook could prompt a market correction.
The labor market remains stable, underpinning consumer confidence. Initial unemployment claims for the week ending July 19 were 217,000.12. This marks a decrease of 4,000 from the previous week.12 The 4-week moving average also decreased to 224,500.12 The insured unemployment rate remains low at 1.3% for the week ending July 12.12 Following six consecutive weeks of declining jobless claims, traders adjusted projections to fewer than two rate reductions this year.2 This robust employment data reduced expectations for immediate Fed rate cuts before the central bank meeting.2
Housing Market and Manufacturing Activity
The housing market presents a mixed picture. Mortgage applications increased 0.8% for the week ending July 18.14. They increased 9.4% for the week ending July 4.15. The 30-year fixed mortgage rate edged higher to 6.84% by July 18.14. It was 6.77% in early July.15 Sales of previously owned homes dropped 2.7% in June from May.16 This marked a 9-month low, reaching a seasonally adjusted annual rate of 3.39 million.16 The median existing-home sales price hit a new all-time high of $435,300 in June.16 This was up 2% from a year ago.16 New single-family house sales in June were 627,000.18 This was up 0.6% from May but down 6.6% from June 2024.19 The median sales price of new houses sold in June was $401,800.19 This was down 4.9% from May.19
Despite low unemployment claims and increasing mortgage applications, the significant drop in existing home sales, coupled with record-high median prices and high mortgage rates, presents a clear affordability challenge. This could dampen consumer spending and broader economic activity. It acts as a potential drag on future growth. The decline in new home median prices might indicate builders adjusting to demand. A prolonged slowdown in the housing market could eventually impact consumer confidence and spending. This could potentially moderate the S&P 500’s growth, especially for sectors tied to consumer discretionary spending or housing-related industries.
Manufacturing and services sectors show diverging momentum. The S&P Global US Composite PMI rose to 54.6 in July 2025.20. This marks a 7-month high and the fastest growth pace in 2025.20. Strong services activity drove this upturn.20 Manufacturing output also increased, but at a more modest pace.20 The ISM Manufacturing PMI was 49.0 in June.21 This indicates continued contraction (below 50) but was slightly above forecast. 21 Nondefense capital goods new orders excluding aircraft were $76.01 billion in May 2025.22. This was up 1.70% from last month and 3.70% from a year ago. 22
Table 3: Selected US Economic Indicators (July 2025)
| Indicator | Latest Value | Period | Details/Trend |
| Initial Unemployment Claims (SA) | 217,000 | Jul 19 | Decreased 4,000 from prior week; 4-week avg also down. |
| S&P Global US Composite PMI | 54.6 | Jul | 7-month high, fastest growth in 2025, driven by services. |
| ISM Manufacturing PMI | 49.0 | Jun | Remains in contraction (below 50), but slightly above forecast. |
| 30-year Fixed Mortgage Rate | 6.84% | Jul 18 | Edged higher, highest in four weeks. |
| Existing Home Sales (SAAR) | 3.39 million | Jun | Fell 2.7% from May, 9-month low. |
| Median Existing Home Sales Price | $435,300 | Jun | New all-time high, up 2% YOY. |
| New Home Sales (SAAR) | 627,000 | Jun | Up 0.6% from May, down 6.6% YOY. |
| Median New Home Sales Price | $401,800 | Jun | Down 4.9% from May. |
| Nondefense Capital Goods New Orders (ex-aircraft) | $76.01B | May | Up 1.7% from prior month, 3.7% YOY. |
This table offers a concise overview of the broader macroeconomic landscape. It allows for a quick assessment of labor market health, manufacturing/services activity, and housing sector trends. This provides context for the S&P 500’s performance and potential future influences. It helps to quickly grasp the overall economic pulse.
Technological Innovation and Cybersecurity Imperatives
Technology, particularly Artificial Intelligence, is a significant growth engine for S&P 500 firms. This innovation, however, introduces complex cybersecurity challenges that demand urgent attention. The interplay of technological advancement and security measures is critical for sustained market performance.
AI is increasingly central to S&P 500 operations.23 327 S&P 500 companies publicly report using AI tools.23 These tools have accelerated innovation and efficiency.23 Technology shares advanced, supported by strong Alphabet Inc. results.2 This reinforces confidence in AI benefits for U.S. technology companies.2 Nvidia Corp reached new price levels.2
However, the adoption of AI is creating “new security challenges”.23 A Cybernews analysis found close to 1,000 potential weak points across S&P 500 companies.23 These vulnerabilities could lead to data exposure, theft of proprietary information, and erroneous AI actions.23 Technology and semiconductor companies are “especially vulnerable” to data leaks and intellectual property risks.23 Financial institutions face challenges protecting client data while ensuring AI does not reinforce unfair bias.23 Past incidents illustrate these dangers. IBM’s Watson once offered unsafe cancer treatment suggestions.23 Samsung experienced unintended source code disclosures due to inappropriate use of AI chatbots by employees 23
AI is undeniably a powerful catalyst for S&P 500 growth, particularly in the technology sector. However, widespread adoption without commensurate safety measures introduces significant risks to data, intellectual property, and operational integrity. This creates a critical tension between innovation-driven growth and the imperative for robust cybersecurity. While AI boosts valuations, failure to address these vulnerabilities could lead to major corporate losses, reputational damage, and regulatory scrutiny. This would potentially impact S&P 500 performance. This also creates a new growth market for cybersecurity solutions and services.
The US-Japan trade agreement targets “semiconductor manufacturing and research, rebuilding U.S. capacity from design to fabrication.”.3 This strategic investment underscores the importance of the high-tech sector. This explicit focus on rebuilding U.S. capacity in semiconductors highlights a national geostrategic priority. This investment aims to secure critical supply chains and foster domestic innovation. It reduces reliance on potentially vulnerable foreign production. This directly benefits S&P 500 semiconductor and high-tech firms by providing capital and a more secure operating environment. This strategic investment signals a long-term commitment to maintaining U.S. leadership in critical technologies. This underpins the growth prospects of a significant portion of the S&P 500. It also implies a focus on intellectual property as a national asset.
Investment Outlook and Future Trajectory
The S&P 500’s current valuation reflects strong optimism, but future performance hinges on navigating ongoing challenges. Understanding market sentiment, potential headwinds, and tailwinds is crucial for investors.
The forward 12-month P/E ratio for the S&P 500 is 22.2.9. This significantly exceeds historical averages.9 This suggests high investor confidence and expectations for future earnings growth. Investors became more confident about the limited economic impact of President Trump’s tariff policies.2 Robust employment data reduced expectations for immediate Fed rate cuts.2 However, trading specialists at Goldman Sachs Group Inc. and Citadel Securities advise clients to secure affordable protection against potential declines.2 They cite “various risks to current market highs.”.2
The S&P 500’s elevated P/E ratio is not solely a reflection of current strong earnings. It also incorporates market anticipation of future growth. This includes potential Federal Reserve rate cuts and the benefits of new trade deals. This indicates that a significant portion of the S&P 500’s value is forward-looking. This forward-looking valuation makes the S&P 500 particularly sensitive to any negative surprises. These could include unexpected economic data, corporate guidance revisions, or shifts in monetary policy expectations.
Several factors could act as headwinds. Tariffs remain an “overhang” on markets.1 The August 1 tariff deadline and potential sector tariffs could introduce caution.1 The seasonally choppy September timeframe is also a concern.1 Furthermore, the significant cybersecurity vulnerabilities from AI adoption present a growing, unquantified risk.23
Conversely, several tailwinds support continued market strength. The Federal Reserve is considering cutting rates.1 A new tax bill is in place.1 More clarity on trade and tariffs is expected.1 Corporate earnings growth is projected to reach around 9% in 2025 and about 14% in 2026.1 The market has “climbed several walls of worry”.1 This suggests that clarity on trade and tariffs, along with the Fed’s eventual rate cuts and a new tax bill, are perceived as significant tailwinds. The resolution of trade uncertainties, such as the July 9th tariff deadline and subsequent deals, provides a more predictable environment for multinational S&P 500 companies. Continued progress on these policy fronts could provide further impetus for the S&P 500. Delays or negative surprises, however, could trigger volatility.
Conclusion: Sustaining Momentum in a Dynamic Environment
The S&P 500’s recent surge is a testament to the resilience of American corporations and strategic government policy. Strong corporate earnings, particularly in technology and financials, underpin this growth. Geopolitical realignments, marked by landmark trade deals with Japan and Indonesia, are fortifying strategic industries and supply chains. These agreements secure critical resources and expand market access for U.S. firms.
While macroeconomic indicators present a mixed picture, with a robust labor market and strong services sector offsetting a challenging housing market, the market remains optimistic. Investors anticipate future rate cuts and greater policy clarity. However, significant cybersecurity risks associated with widespread AI adoption present a growing challenge. Unaddressed vulnerabilities could impact corporate performance and investor confidence. Sustaining this momentum requires vigilant management of these complex interdependencies. Investors must remain agile, recognizing both the profound opportunities and emerging risks in this dynamic environment.
References:
- Weekly Stock Market Update | Edward Jones
- Asian stocks dip, breaking longest winning streak; S&P 500 notches record closing highs – Fed uncertainty weighs on global sentiment.
- Fact Sheet: President Donald J. Trump Secures Unprecedented U.S.–Japan Strategic Trade and Investment Agreement – The White House
- Trump hails $550 billion agreement with Japan as ‘largest trade deal’, claims US to gain 90% profits.
- Fact Sheet: The United States and Indonesia Reach Historic Trade Deal – The White House
- Joint Statement on Framework for United States-Indonesia Agreement on Reciprocal Trade – The White House, 2025
- Status of U.S. Bilateral Trade Negotiations as the July 9 Deadline Approaches | Insights
- EU trade relations with the United States – European Union
- S&P 500 Earnings Season Update: July 18, 2025,
- When Is the Next Fed Meeting? 2025 Complete Schedule | EBC Financial Group
- Calendar – Federal Reserve Board
- News Release – U.S. Department of Labor
- Initial Claims (ICSA) | FRED | St. Louis Fed
- Mortgage Applications Increase in Latest MBA Weekly Survey
- Mortgage Applications Increase in Latest MBA Weekly Survey
- Existing-Home Sales Fall in June, Prices Hit All-Time High – Realtor.com
- NAR Existing-Home Sales Report Shows 2.7% Decrease in June – GlobeNewswire
- US Monthly New Residential Sales, June 2025
- New Residential Sales Press Release – U.S. Census Bureau
- United States Composite PMI – Trading Economics
- United States ISM Manufacturing PMI – Investing.com
- US Nondefense Capital Goods Excluding Aircraft New Orders
- The adoption of AI by S&P 500 firms is creating new security challenges
S&P 500 Long (Buy)
Enter At: 6382.03
T.P_1: 6421.78
T.P_2: 6499.88
T.P_3: 6569.03
T.P_4: 6656.08
T.P_5: 6796.66
T.P_6: 6913.81
T.P_7: 7015.34
T.P_8: 7164.87
S.L: 5867.27